17th of MAY 2004
Soil samples sent to the USA
SAMPLING
In spring, when the snow had melted and the frost was out of the ground, soil sampling was carried out where the ice pattern had been laying. The samples were collected on the 12th of May 2004 by Andres Mona and the land owner Leif Aune, and sent to BLT Research Team for laboratory analysis.
The Norwegian Crop Circle Group as well as the people at Snåsa is now anxiously awaiting the results.
RESULTS
Chemical analysis of soil samples did not reveal anything unusual
The soil samples that were collected at the site where the 15m long ice pictogram was located during the winter 2003/2004, have now been analysed by BLT Research Team, USA:
Frontier Analysis Ltd
■ No extraneous chemical contaminant was detected in the sample soils
from the ice-pictogram, as compared to the control soils (see graph above).
■ Ammonium nitrate (a common fertilizer) was detected in similar amounts
in both the pictogram samples and the controls, as well as other natural
soil organics, as a small amount of natural ester and a very trace level of a
waxy long chain hydrocarbon.
Sampling
By following the BLT Research Teams instructions, eight soil samples were collected from the field where the ice circle was located, - four samples from within the ice rings and pathway locations, and four control samples at respectively 20 and 40 meter in distance from the formation area. The samples were collected on the 12th of May 2004 by Andres Mona and the land owner Leif Aune, and sent to BLT Research Team for laboratory analysis.
Analysis procedure
Infrared spectroscopy was conducted on the soil samples and controls in the “as received” condition, as well as on three solvents extracted from these soils by the use of progressive polar solvents, i.e. hexane, acetone:methanol and water.
Results
The analysis revealed that no extranous chemical contaminant was detected in the sample soils from the ice-pictogram, as compared to the control soils (see report 5 below). There was materials detected in both pictogram and control soils. Ammonium nitrate was predominating. This is from fertilizer. There also was other natural soil organics, which includeed a small amount of natural ester and a very trace level of a waxy long chain hydrocarbon.
Discussion
Because the “ice-pictogram” design was formed by a layer of ice on to of the field, and because there is no known structure beneath the surface nor any evidence of structure on top of the field, the question was raised as to whether a chemical of some sort had been applied topically which caused the ice to form in this design.
Since the infrared spectroscopy of both the control and sample soils are identical (and neither show extraneous chemical contaminations), and since only remnants of ammonium nitrate (fertilizer) and other natural soil organics were found in any of the samples, the hypothesis that a topically-applied chemical was responsible for the creation of the design seems highly unlikely.
Conclusion
The BLT Research Team concludes the report as follows: Based on our current data we cannot determine what might have caused the ice to form the pattern.
For further details, please read the whole BLT report underneath!
REPORTS
Report 6 May 2005 Research Report, BLT RESEARCH TEAM INC, USA - NEW!
Test results and conclution: No anomalous findings.
Report 5 2005.05.17 Laboratory Report, Frontier Research, Ohio, USA - NEW!
By Phyllis A. Budinger, chemical analyst.
Report 4 2004.29.05 Soil samples sent to USA
Sampling of the soils carried out in spring 2004.
Report 3 2004.21.02 The ice circle at Snåsa revisited
Melting of snow made the circle visible, allowing new survey.
Report 2 2004.28.01 Comments by the Norweigan Crop Circle Group
Our first report on the ice-circle, containing local conditions.
Report 1 2004.28.01 The account of the observers
The youngsters own story of the findings the dec. 11th, 2003.
THANKS TO ALL INVOLVED
The fact that the ice pictogram was found 600km away from where any of the researchers in The Norwegian Crop Circle Group reside, represented quite a challenge when it came to carrying out the examination of the formation. We therefore want to express our greatest gratitude to the local reporters, surveyors and samplers at Snåsa! Thanks also to the BLT Research who have carried out the research on this highly unusual ice pictogram.
ALL INFORMATION PUBLISHED
All available information about the formation is posted on this web site. All existent photos can be found under Photographs in the main presentation.
THE MYSTERY NOT SOLVED
Even though we consider the "case closed" for now, it still remains a mystery that is in no way resolved! Should any new information surface, it will be added chronologically (with the newest information on the top).
Read BLT's full report:
BLT RESEARCH TEAM INC.
Cambridge, MA (USA)
[www.bltresearch.com] BLT Research Report #0501
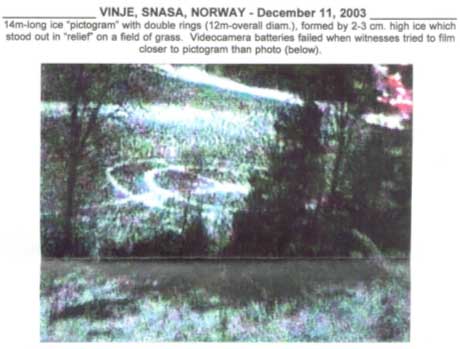
_______ VINJE, SNASA, NORWAY - December 11, 2003 _______
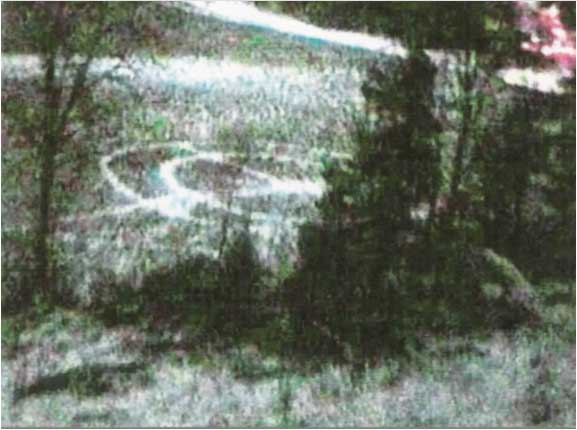
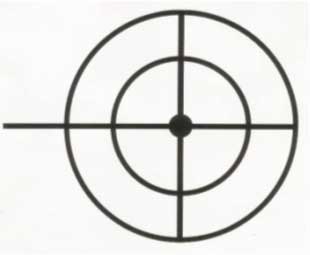
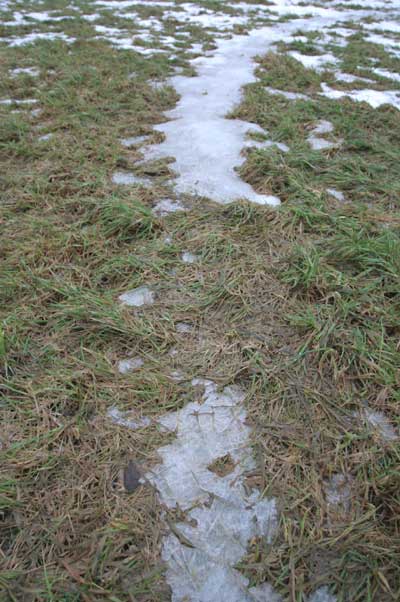
A 14m-long “ice-pictogram” w/double rings; design formed by ice 2-3 cm high which stood out in “relief” on a field of grass when snow fell and covered ice. Videocamera batteries failed when witnesses tried to film closer to pictogram than photo below.
BLT Research Report #0501
p. 2
Ice "Pictogram"
VINJE, SNASA, NORWAY – 2003
File Code: BLT #0501
Date of BLT Report: May, 2005
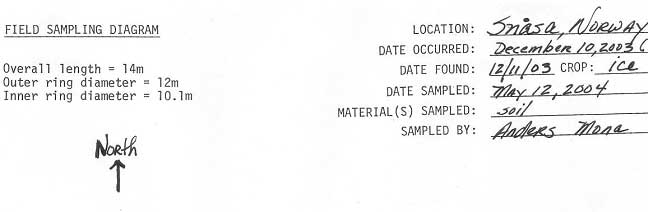
Event Location: Field near Vinje, Snasa, Norway
Date Discovered: December 11, 2003
Date Sampled: May 12, 2004
Material Sampled: Soil
Sampled By: Mr. Anders Mona, for The Norwegian Crop Circle Group
Event Description:
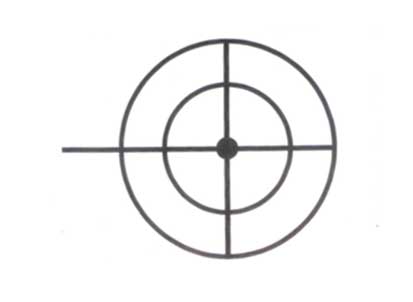
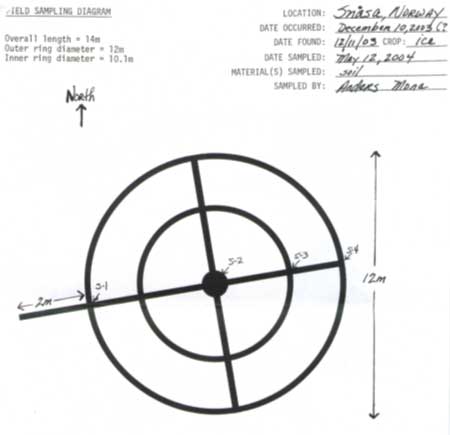
A 14m overall length, double-ring design with intersecting right-angled pathways, one of which extends West/Southwest beyond circular pattern. Rings and pathways created by ice deposits on top of grass which were approximately 30 cm. wide by 2-3 cm high (see Figs. 1-3).
Sampling Details:
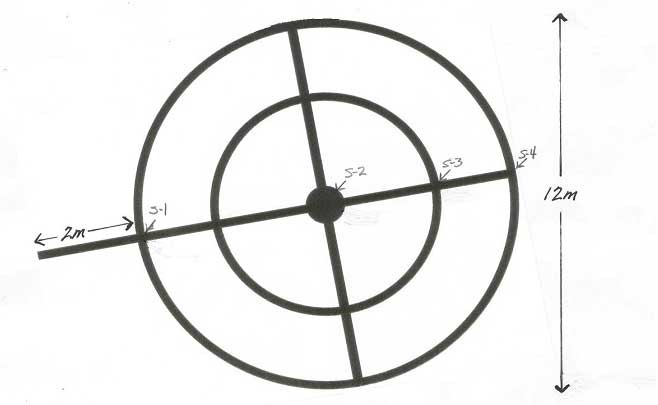
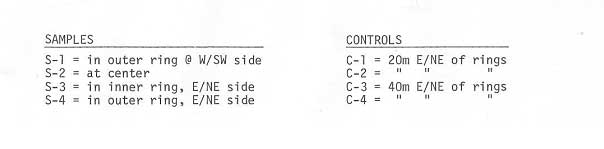
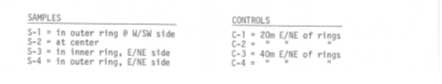
Four soil samples were taken from the ice rings and pathway locations, many of which were still visible due, at sampling, to the absence of grasses in these areas (see Fig. 4). Four controls were also taken, 20m - 40m distant (see Fig. 5 – "Sampling Diagram").
Laboratory Analysis:
Infrared spectroscopy conducted on soil samples and controls in the "as received" condition, and on solvents extracted from these soils, by Phyllis Budinger, Analytical Chemist, Frontier Analysis, Ltd – Chagrin Falls, Ohio (See full report, attached)
Results:
1. No extraneous chemical contaminant was detected in the sample soils from the ice-pictogram, as compared to the control soils;
2. Ammonium nitrate (a common fertilizer) was detected in similar amounts in both the pictogram samples and the controls, as well as other natural soil organics.
Discussion:
Because the "ice-pictogram" design was formed by a layer of ice on top of the field, and because there is no known structure beneath the surface nor any evidence of a structure on top of the field, the question was raised as to whether a chemical of some sort had been applied topically which caused the ice to form in this design?
Since the infrared spectra of both the control and sample soils are identical (and neither show extraneous chemical contaminants), and since only remnants of ammonium nitrate (fertilizer) and other natural soil organics were found in any of the samples, the hypothesis that a topically-applied chemical was responsible for the creation of the design seems highly unlikely. Based on our current data we cannot determine causation.
BLT Research Report #0501
p. 3
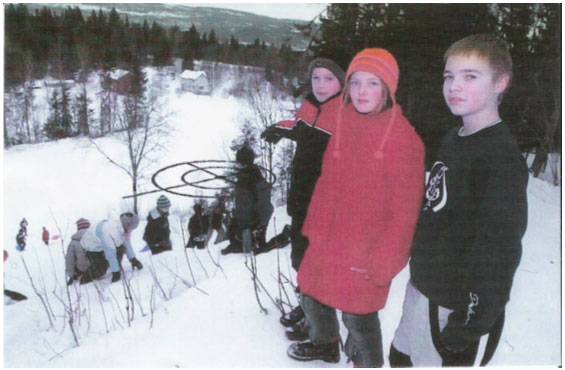
Fig. 1:
School-children (top) who discovered ice-pictogram pointing to area (now covered with snow but w/pattern drawn-in on photo) where pattern was found on 12/11/03.
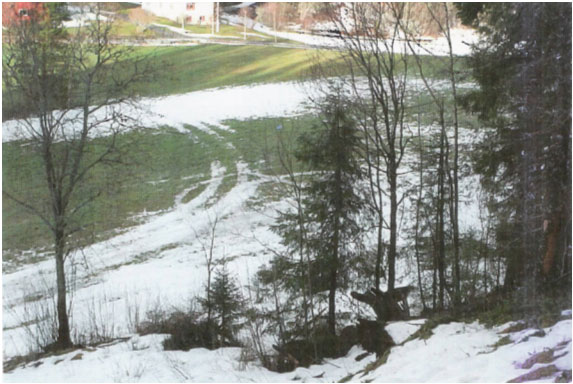
Bottom photo shows pattern later on, when snow-cover had melted a bit.
BLT Research Report #0501
p. 4
Fig. 2:
Ice-pictogram two months later, on February 21, 2004. The ice-rings and pathways which form the design are approximately 30 cm in width. Photos: Thor Riseth.
BLT Research Report #0501
p. 5
Fig. 3:
Close-up of one ice ring (approx. 30 cm wide), photographed in February, 2004; note color alteration in grasses where ice-ring has melted. Photo: Thor Riseth.
BLT Research Report #0501
p. 6
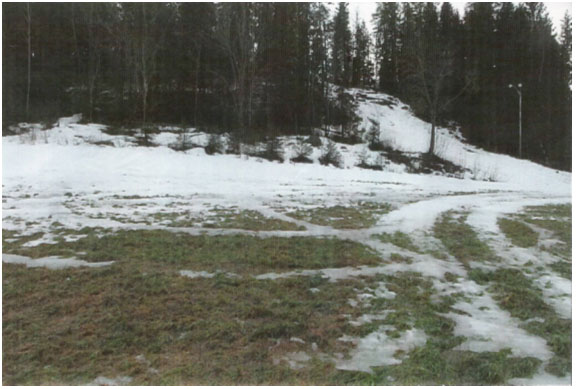
Fig. 4:
Anders Mona and associate taking soil samples in May, 2004 for chemical analyses;some of the rings and pathways of the ice-pictogram were still visible (due at this time in May to the absence of grasses in these areas), making sampling relatively easy.

BLT Research Report #0501
p. 7
Fig. 5:
Blt Research Team Inc., Cambridge, MA, USA www.bltresearch.com BLT Research Report #0501
Rapport nbr. 5 - 17th of MAY 2005

17100 Wood Acre Trail
Chagrin Falls, Ohio 44023
Phone/Fax: 440-708-2211
Email: BudingerPA@MSN.com
TECHNICAL SERVICE RESPONSE NO.: UT040
Subject: Analysis of Soils from an Ice Pictogram Formation which was found in Snasa, Norway (December 2003)
Date: May 17, 2005 Requested By: Nancy Talbott
BLT Research
" Reported By: P. A. Budinger
Analytical Scientist
Background/Objective:
The background as described by Nancy Talbott follows.
“A most unusual pictogram” was found in Norway in December 2003. It was made up of ice, 2-3 cm high, formed in rings and pathways. A light snow had fallen on top of the ice circle making it clearly visible.
The following spring fieldworkers took 4 soil samples and 4 soil controls in the hopes that you could look at them for any sign of a contaminant in the soils that might account for the ground/snow melting and then re-freezing. Interviews with locals provided no ready explanation for the marking. The field was simply a grass field/meadow. That spring of 2004 showed some of the marking in the growing grass where, apparently, the grass was not growing normally. From the photo it looks as if the ring areas may have been mostly dirt in 2004, when sampled. Perhaps some substance has impeded the growth of the grasses? The field team says that lime and fertilizer had been spread on this field by the farmer one week or so before the soil samples were taken.”
The object of this analysis is to determine whether any contaminants are present in the pictogram soils that would produce the observed design.
Conclusions:
· No unusual contamination was detected in the pictogram soil. Either no chemical was used to produce the pictogram, or it was depleted and dispersed into the soil long before sampling.
· There are materials detected in both pictogram and control soils. Ammonium nitrate predominates. This is from fertilizer. There are also other natural soil
T. S. R. No.: UT040
Frontier Analysis, Ltd
Page 3
organics, which include a small amount of natural ester and a very trace level of a waxy long chain hydrocarbon.
Procedure:
The samples consist of four soils from the pictogram and four control samples. The Pictogram was noted In December 2003. The soils were sampled four months later on12 May 2004.
Following is a ring diagram of the formation showing the sampling locations.
Infrared spectra were obtained from selected “as received” soils. Additionally, all soils were solvent extracted using progressively polar solvents, i.e. hexane, 1:1 acetone:methanol, and water. This was done quantitatively to determine the amounts of each extract. Infrared spectra were acquired from selected extracts.
T. S. R. No.: UT040
Frontier Analysis, Ltd
Page 4
Results:
Analysis of the “As Received “ Soil
Infrared spectra of the control soil and pictogram soil are identical. That is, the pictogram soil shows no extraneous contaminant absorption compared to the control soil. Following are selected spectra of a pictogram soil (S2) and a control soil (C1) for comparison.
Infrared Spectra of the S2 Pictogram Soil and C1 Control Soil
Analysis of the Solvent Extracts from the Soil
The amounts of extracted material are very low. They are about the same for the pictogram soils and control soils, i.e. within experimental error. This indicates there is no contamination present. The amounts for each extract (hexane, 1:1 acetone:methanol, and water) follow.
Amounts of Extracts from the Pictogram Soils and Control Soil
T. S. R. No.: UT040
Frontier Analysis, Ltd
Page 5
Infrared analysis of the extracts from selected soils from the pictogram and controls display similar spectra. The spectra show no additional absorption from contamination in the ring soils when compared those from the controls. The following components were found in the in the extracts.
Representative spectra from a pictogram soil and control soil from each extract follow. Pertinent absorption peaks are labeled.
Infrared spectra of Hexane Extracts from a Pictogram Soil (S2) and a Control Soil (C3)
Infrared spectra of Acetone:Methanol Extracts from a Pictogram Soil (S2) and a Control Soil (C4)
T. S. R. No.: UT040
Frontier Analysis, Ltd
Page 6
Infrared spectra of Water Extracts from a Pictogram Soil (S2) and a Control Soil (C3)
FILE: UT040
___________________
Phyllis A. Budinger
Frontier Analysis, Ltd, 17100 Wood Acre Trail, Chagrin Falls, Ohio 44023 Phone/Fax: 440-708-2211
Rapport nbr. 4 - 29th of MAY 2004
Rapport
nr. 6 - MAI 2004
BLT RESEARCH
TEAM INC.
Cambridge,
MA (USA)
[www.bltresearch.com]
BLT Research Report #0501
______
VINJE, SNASA, NORWAY - December 11, 2003
______
A 14m-long ice-pictogram
w/double rings; design formed by ice 2-3 cm high which stood out in relief on
a field of grass when snow fell and covered ice. Videocamera
batteries failed
when
witnesses tried to film closer
to pictogram than photo below.
BLT Research Report#501
p. 2
Ice "Pictogram"
VINJE, SNASA,
NORWAY 2003
File Code:
BLT #0501
Date of
BLT Report: May, 2005
Event
Location: Field near
Vinje, Snasa, Norway
Date
Discovered: December
11, 2003
Date
Sampled: May 12, 2004
Material
Sampled: Soil
Sampled By:
Mr. Anders Mona, for The Norwegian Crop Circle Group
Event
Description:
A 14m overall length,
double-ring design with intersecting right-angled
pathways, one of which
extends West/Southwest beyond circular pattern.
Rings and pathways created by ice deposits on top of grass
which were approximately
30 cm. wide by 2-3 cm high (see
Figs. 1-3).
Sampling
Details:
Four soil samples were
taken from the ice rings and pathway locations,
many of which were still visible due, at sampling, to the absence of grasses
in these areas (see Fig. 4). Four controls were also
taken, 20m - 40m distant
(see Fig. 5 "Sampling Diagram").
Laboratory
Analysis
Infrared spectroscopy conducted on
soil samples and controls in the "as received" condition, and on solvents extracted from these soils, by Phyllis Budinger,
Analytical Chemist, Frontier Analysis, Ltd Chagrin Falls, Ohio (See full
report, attached)
Results:
1. No extraneous chemical contaminant was detected in the sample soils
from the ice-pictogram, as compared to the control soils;
2. Ammonium nitrate (a common fertilizer) was detected in similar
amounts in both the pictogram samples and the controls, as well as
other natural soil organics.
Discussion:
Because the "ice-pictogram" design was formed by a layer of ice on top of
the field, and because there is no known structure beneath
the surface nor any evidence of a structure on top of the field, the
question was raised as to whether a chemical of some sort had been applied topically which
caused the ice to form in this design?
Since the infrared spectra of both
the control and sample soils are identical
(and neither show extraneous chemical contaminants), and
since only remnants of ammonium nitrate (fertilizer)
and other natural soil organics were found in any
of the samples, the hypothesis
that a topically-applied chemical was responsible
for the creation of the design
seems highly unlikely. Based on our current data
we cannot determine causation.